Total international air arrivals to Cape Town International Airport between January and February surpassed the 200 000 mark and exceeded the 2019 figure of 194 058 for the same period, breaking all previous records in the last five years.
At key attractions in regions across the province, visitor numbers are up 20% year-on-year.
“This is yet more excellent news for the sector because we know that more tourists mean more jobs across the province,” said Provincial Minister of Finance and Economic Opportunities, Mireille Wenger.
This is according to the monthly tourism report for February 2024, compiled by the Western Cape Government’s tourism, trade, and investment promotion agency, Wesgro.
Other highlights from the report include:
- Two-way passengers through Cape Town International Airport’s international terminal saw a 14% year-on-year growth in February, with 294 443 passengers, maintaining a steady growth rate on the back of a 13% increase recorded in January. (Source: Acsa)
- The domestic terminal recorded a 14% year-on-year growth in February, with over 576 000 two-way passengers passing through the terminal. (Source: Acsa)
- George Airport recorded over 59 000 two-way passengers in February, approaching full recovery compared with pre-COVID levels. (Source: Acsa)
- In February, 92% of the international air arrivals to Cape Town were from overseas markets (other than Africa) and 8% were from the rest of Africa. (Source: StatsSA)
- Between January and February, the UK led as the top overseas air market to Cape Town, with Germany a very close second, followed by the US, the Netherlands, and France in the top five positions. (Source: StatsSA)
- Between January and February, Namibia led as the top air market from the rest of Africa to Cape Town, with Zimbabwe following closely in second position. Mozambique, Angola, and Kenya followed in the rest of the top-five positions. Air arrivals from the rest of Africa to Cape Town during this period reflected a full recovery from seven out of the top-ten Africa source markets to Cape Town compared with Jan-Feb 2019. These markets included Zimbabwe (135%), Mozambique (18100%) Should it be 181%?, Kenya (202%), Nigeria (112%), Tanzania (176%), Ghana (304%) and Botswana (1129%). (Source: StatsSA)
- 43 participating attractions across the six regions of the Western Cape recorded a total of just over 1.7 million visitors between January and February, a 20% growth when compared with January-February last year. (Source: Wesgro)
- The top-five participating Western Cape attractions with the highest volume of visitors between January and February were recorded for: Table Mountain National Park (641 486); Table Mountain Aerial Cableway (227 511); Table Mountain National Park: Cape of Good Hope (199 781); Table Mountain National Park: Boulders (171 754); and Kirstenbosch National Botanical Gardens (136 422). (Source: Wesgro)
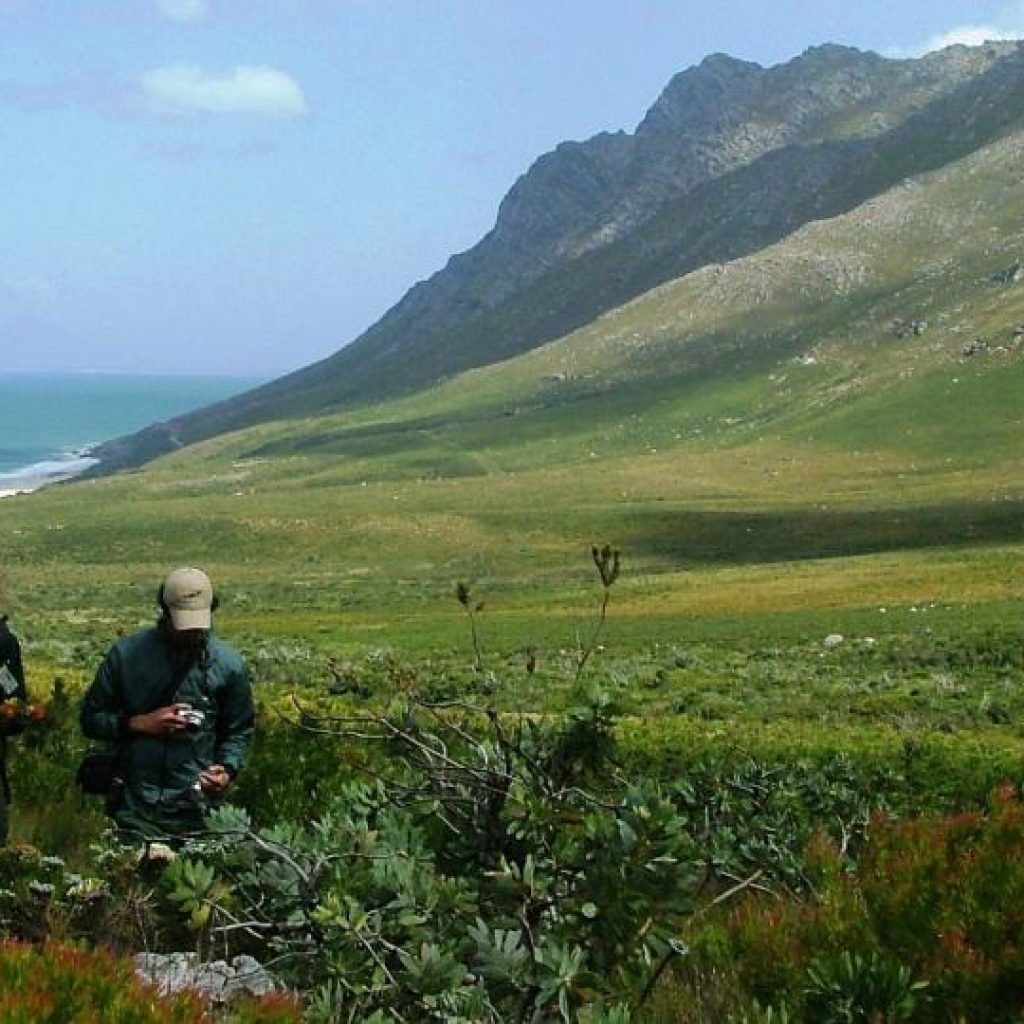
- The top-five highest year-on-year growth rates between January and February were recorded among the Western Cape’s nature/outdoor attractions: Stony Point Eco Venue (476%); Grootvadersbosch Eco Venues (386%); De Hoop Nature Reserve (188%); Gamkaberg Nature Reserve (135%); and Kogelberg Nature Reserve (130%). (Source: Wesgro)
“Data from SA Tourism shows that, for every 100 international visitors to the Western Cape, R2.1 million (€104 080) in direct tourist spend is generated, contributing R500 000 (€24 780) to the provincial GDP, and enabling two local jobs,” Wenger continued.
“This success has not happened by chance and would not be possible without the hard work and dedication of our local tourism industry, the curiosity and trust of our precious tourists, and the determination of this government, entities, and partners. I thank each person who continues to work hard to welcome our visitors and to ensure that they keep coming back, helping to grow our provincial economy, and creating many more jobs around the Western Cape,” Wenger concluded.


About The Author: David DiGregorio
More posts by David DiGregorio